Guide · General
Customer Retention Software: How to Pick the Right One
Compare customer retention software categories, key features, pricing models and data requirements, then assess which fits your business needs in 2026.
By the KeenVerdict research desk · Updated November 13, 2026 · 14 min read
Only 4% of respondents in 2024 planned to invest directly in loyalty software, apps or customer-retention technology, according to CX Network's Global State research. That looks like indifference. Read it again and it's something more useful: retention work gets funded through CRM, help desk and customer success budgets, which is why buyers end up holding a loyalty platform quote next to a helpdesk quote and wondering why the feature lists don't line up.
Customer retention software isn't one product. It's five categories that see different signals, and the correct choice depends on where your customers leave rather than on which vendor shipped the longest feature page.
Two things get skipped in most roundups of this market. The first is the three-year cost, which rarely resembles the monthly price. The second is whether automated outreach helps or hurts at the moment a customer is already unhappy. Both decide whether the software pays for itself, and both get examined below.
Table of Contents
- Customer Retention Software Categories at a Glance
- How Retention Software Spots and Stops Churn
- Matching the Software to Your Retention Problem
- Pricing Models and What You Actually Pay
- Features, Data and Privacy to Verify Before You Buy
- When AI Retention Helps and When It Backfires
- Run a Controlled Test Before You Sign
Customer Retention Software Categories at a Glance
Customer retention software splits into five working categories, and the right one is the category that can observe your exit point. A loyalty platform sees the gap between purchases. A cancellation tool sees a card that failed three times. Find your row before reading a single vendor page.
| Category | Main job | Signals it relies on | Typical buyer |
|---|---|---|---|
| Loyalty and rewards platforms | Run points, tiers and offers | Purchase frequency, redemption, program enrollment | Retail and ecommerce brands |
| Engagement and in-app messaging | Guide and re-engage users | Product usage, logins, feature adoption | SaaS teams with product usage data |
| Customer success platforms | Health scoring and renewal tracking | Usage, support history, payment status, account-manager notes | Account teams managing renewals |
| Helpdesk tools with retention features | Resolve issues before they cause cancellation | Ticket volume, satisfaction, response times | Support-led service businesses |
| Cancellation and churn prediction tools | Flag and save at-risk subscribers | Payment failures, cancellation intent, inactivity | Subscription businesses with recurring billing |
Most of these platforms sit on top of customer data a CRM already holds: profiles, interaction history, segmentation, automated communications, service workflows and renewal dates. A business without a working CRM should settle that first. A health score or a loyalty tier built from spreadsheet exports produces confident numbers nobody trusts.
The market underneath the category list
Worldwide CRM software revenue grew 13% in 2013, per Gartner's CRM market release. Retention tooling grew inside that market rather than beside it, which is why almost every category in the table above expects to read from a CRM.
Delivery moved too. Gartner reported that SaaS reached about 72.9% of CRM spending in 2018, and that worldwide spending on customer-experience and relationship-management software hit $48.2 billion in 2018 after growing 15.6% year over year, as Gartner's customer experience spending release sets out. Subscription delivery is the reason a churn score can update overnight and a support history can reach the marketing team the same morning.
Where the categories blur
Helpdesk suites add retention reporting, customer success platforms add in-app messaging, and cancellation tools add payment recovery. Buyers overspend in that overlap, paying for three products that all claim the same renewal. For the account-health end of the list, KeenVerdict's software rankings score products and quote current prices, which is the right comparison set only if renewals are where your revenue leaks.
Pick the category that can see the moment customers leave. A tool that can't observe the exit stage will produce accurate-looking scores and retain nobody.
How Retention Software Spots and Stops Churn
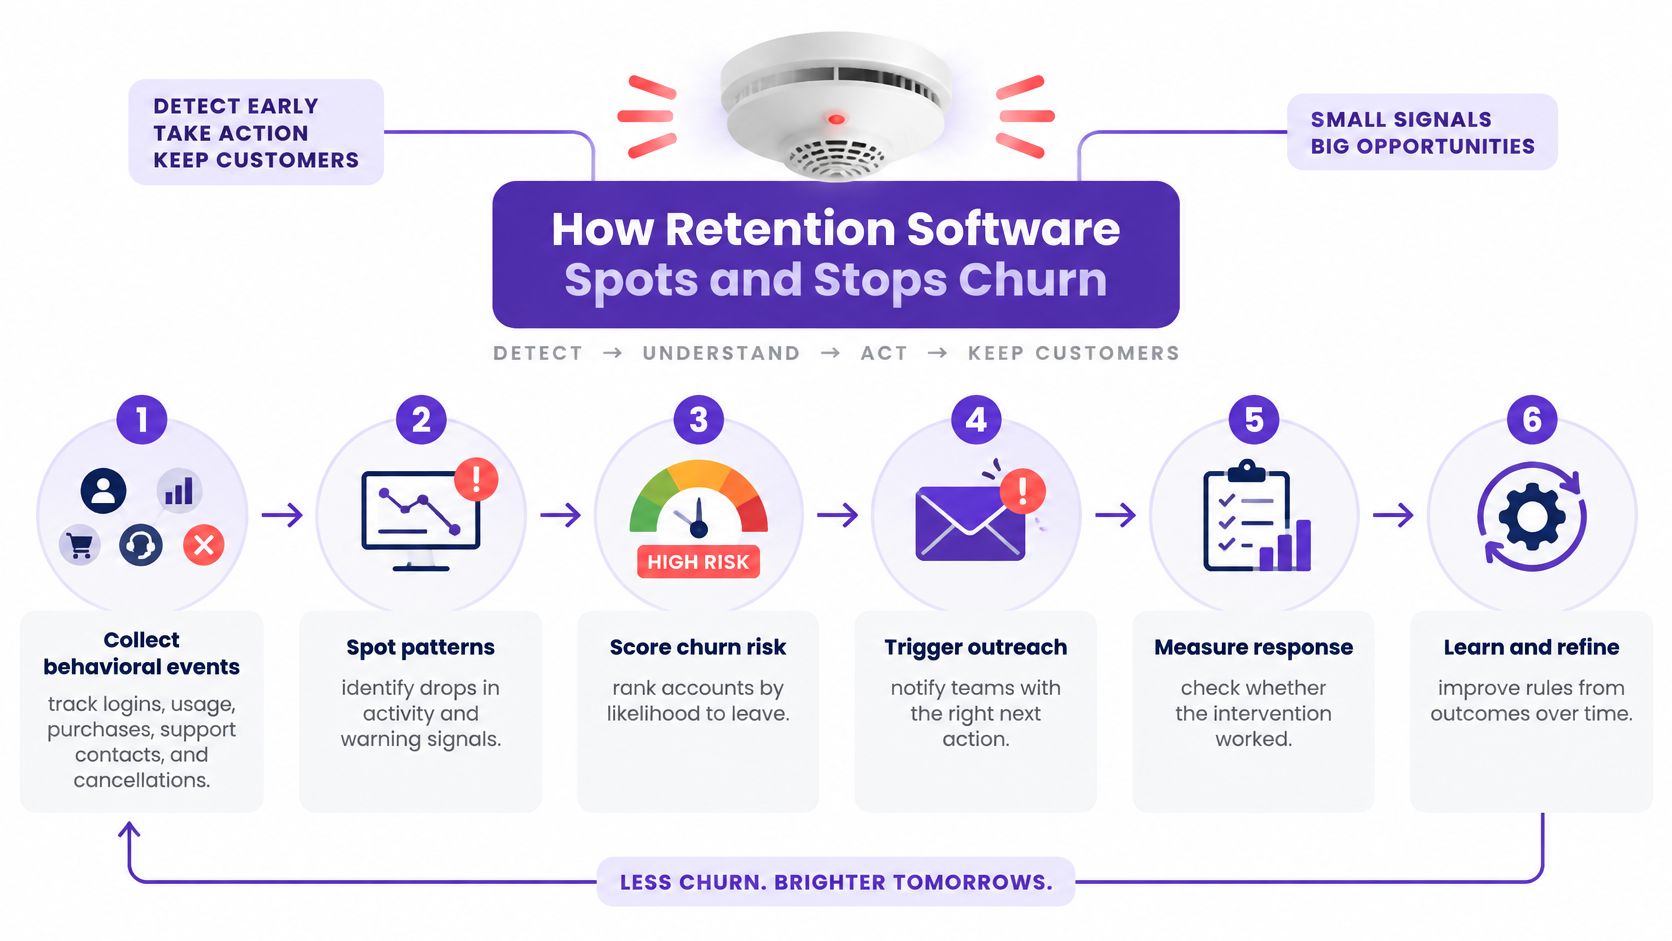
Think of the software as a smoke alarm wired to a phone call. Detection is the cheap part. The value sits in what happens in the ten minutes after the alarm sounds, and a platform that flags 200 at-risk accounts and sends all of them the same discount email has done detection and skipped the useful work.
The loop that retains customers runs in six steps, and it only works when every step exists.
- Collect behavioral events. Logins, transactions, support contacts, feature use and cancellations. A missing channel is a blind spot, and a blind spot scores the customer wrongly.
- Spot patterns in the change, not the level. Sessions this month against the last three months tells you more than a static total ever will.
- Score churn risk daily or weekly. A monthly refresh is too slow for a customer whose renewal is in nine days.
- Trigger a different action for each risk band. A quiet mid-value account gets a helpful email about the feature it never opened. A high-value account with an open complaint gets a named person on the phone.
- Suppress the over-contacted. Customers already in three campaigns should not receive a fourth, and suppression rules belong in the platform, not in someone's memory.
- Measure every action against a randomized control group. Otherwise you're counting customers who would have stayed anyway.
Which signals actually predict the exit
A study of 17,032 telecommunications and retail-banking customer records, published in the churn modelling study of 17,032 customer records, found that frequency and engagement decline were stronger churn signals than monetary value, inactivity duration, complaint intensity or recency. That finding alone should change how you rank accounts. A Gradient Boosting model delivered the best balance of precision and recall at an F1 score of 0.55 and ROC-AUC of 0.80, while XGBoost posted the highest raw accuracy at 74.2%, with every model tested falling inside a narrow 66% to 74% accuracy band.
The gap between that 74.2% accuracy and the 0.55 F1 score is the number to keep in your head during a demo. Class imbalance lets a weak model look strong while it misses most of the customers who leave. Ask for precision, recall, ROC-AUC or PR-AUC, calibration, feature-level explanations, and performance measured on a time-based holdout rather than a random split.
Practical test: the loop works when churn falls in the treated group compared with the control. A tidy list of flagged accounts proves the alarm works, not that anyone was retained.
Matching the Software to Your Retention Problem
Three situations cover most of the buyers who land on this category, and each one points somewhere different.
A SaaS company watches trial users stop logging in after the second week. The exit point is onboarding, so the job is feature adoption inside the product, not a renewal save. A retail brand's points program has more members than last year and flat repeat purchases. The membership count is vanity; the missing measurement is redemption cost against retention lift by segment. A support team sees ticket volume climb for three months before cancellations rise. Support is the leading indicator, and no loyalty tier will fix a queue that takes nine hours to answer.
| Situation | Start with | Verify first |
|---|---|---|
| Retail or ecommerce brand with a points program | Loyalty and rewards platform | Redemption cost and retention lift by customer segment |
| SaaS product with login and feature data | Engagement and in-app messaging | Event tracking coverage and CRM integration |
| Account team managing annual renewals | Customer success platform | Non-product signals and rollout timeline |
| Support-led service business with rising ticket volume | Helpdesk with retention reporting | Link between ticket trends and cancellations |
| Subscription business losing customers at billing | Cancellation and churn prediction tool | Failed payment handling and consent controls |
| Small team with no customer data platform | Existing CRM with retention workflows | Whether the CRM can store usage, support and billing signals |
Read the table from the row closest to where customers leave, then confirm the category can see that stage in your data. A loyalty platform can't score an onboarding drop-off it never observes, and a churn prediction model trained on billing events alone will miss the customer who is unhappy but still paying.
Loyalty is not automatically the answer
Outsourcing the program helps. 61% of respondents whose loyalty programs were managed by a technology-solution vendor were satisfied with those programs, compared with 51.1% of those using in-house technology, according to Digital Marketing News' summary of Antavo research. What outsourcing doesn't do is guarantee a lift: a 2026 study hosted by the University of Johannesburg reported no statistically significant differences among the loyalty strategies it tested across all behavioral indicators, per the University of Johannesburg loyalty program study. Enrollment is an activity metric, and activity is not retention.
A small team without a customer data platform should confirm its CRM can hold usage, support and billing signals before buying a specialist layer. The guide to choosing a CRM covers how to test that during a trial rather than after a rollout.
Write one sentence naming the stage where your customers leave. That sentence becomes the test brief when you get to procurement.
Pricing Models and What You Actually Pay
Retention software is priced four ways: per seat or agent, by flat monthly plan, by active user tier, or by enterprise contract. Whichever model you meet, the number on the pricing page is usually the smallest line in the deal. A 2026 comparison published by Time to Reply lists the published figures below, and reports that six of the 11 tools it reviewed did not publish prices at all, per Time to Reply's 2026 retention software comparison.
| Vendor | Pricing model | Published price | Source and year |
|---|---|---|---|
| Zendesk | Per agent | $19 per agent per month, billed annually | 2026 published comparison |
| HubSpot Service Hub | Per seat | $20 per seat per month | 2026 published comparison |
| Userpilot | Active user tier | $299 per month for 2,000 active users | 2026 published comparison |
| Churnkey | Flat monthly | $250 per month, billed annually | 2026 published comparison |
| Gainsight | Enterprise contract | Commonly $25,000 to $250,000 or more per year | 2026 published comparison |
| Other reviewed tools | Not published | Six of 11 tools did not publish prices | 2026 published comparison |
The multiplication most buyers skip
Per-agent pricing looks modest until the headcount arrives. Twelve agents at $19 per agent per month, billed annually, comes to $228 a month, or $2,736 a year, before add-ons, implementation, integration, usage charges and contract terms. Twenty-five agents on the same plan reach $5,700 a year. Most help desk prices in KeenVerdict's help desk ranking are per agent per month, so the number of people who answer tickets has to be multiplied in before any comparison means anything.
Active user pricing has the same trap from the other side. A flat $299 a month for 2,000 active users is cheap for a product with 900 active accounts and expensive for one with 60,000, where the tier ladder resets the bill every few months.
The three lines to add to every quote
- Platform fee for real users. Count only the people who need access, then add the ones who will need it within a year. Access creep is the usual reason a renewal costs more than the original contract.
- Implementation and integration. CRM sync, billing connection, event tracking and data cleanup. A tool that needs six months of engineering has a cost the subscription line never shows.
- Usage or contact volume. Messages sent, contacts stored, events tracked, support tickets handled. Volume pricing turns a fixed bill into a variable one, and the variable one grows with your best month.
Build a three-year total for each shortlisted vendor using the same seat count and the same usage assumption, then compare totals. Two vendors with a $10 difference in monthly headline price can differ by five figures over the contract.
Compare three-year totals at identical seat counts. A monthly headline price is a marketing number until the seat count and usage volume are fixed.
Features, Data and Privacy to Verify Before You Buy
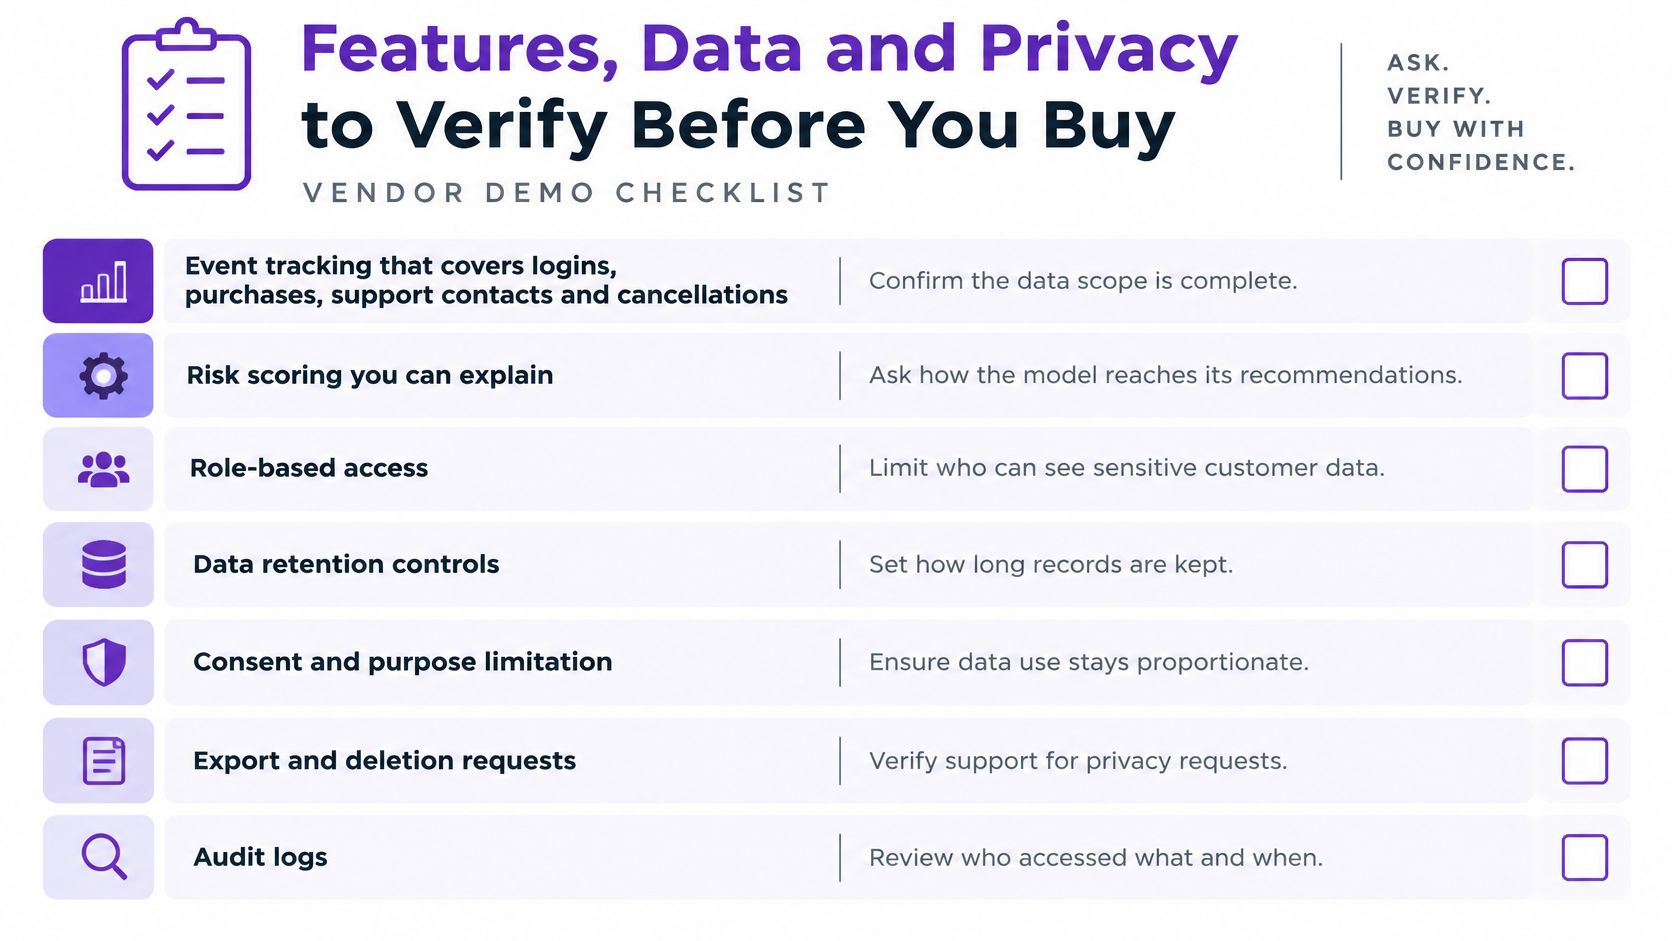
Run this list against every demo and ask each question in writing. A strong answer is specific and dated. A weak answer is a roadmap item, and it's a cost you'll carry after signing.
- Event tracking for the full journey. Logins, purchases, support contacts and cancellations are the minimum. Ask which events arrive by default and which need custom instrumentation, then ask how long tracking took for the last customer who looks like you.
- Non-product signals. Support history, payment status and account-manager notes matter most where customers rarely log in. Ask how those signals enter the score, because a product-usage model has nothing to read for a customer who logs in twice a quarter.
- CRM and billing integration. Scores have to update where customers change. Ask whether the integration is native, what syncs, how often, and what happens to a record when a deal closes or a subscription is cancelled mid-term.
- Suppression rules. Ask whether the platform can exclude customers already contacted in the last fortnight, or those with an open complaint. Without suppression, automation turns into the reason someone leaves.
- Holdout measurement. Ask whether the tool can hold a group back and report results against it. A vendor that answers with open rates and clicks has no answer for who stayed.
- Score quality reporting. Ask for precision, recall, ROC-AUC or PR-AUC and calibration, not accuracy. Class imbalance makes a weak model look strong, and a demo deck rarely volunteers the difference.
- Reasons attached to each flag. A health score of 41 means nothing to an account manager. Ask for the top three contributing factors per account, in plain language, and check whether they update as behavior changes.
- Data controls. Data minimization, consent and purpose limitation, export and deletion on request, regional hosting and audit logs. Ask who accessed a customer record last month and watch how long the answer takes.
What implementation actually costs
Customer success platforms carry the heaviest load. A 2026 comparison of retention software for agencies describes Gainsight as typically taking three to six months to roll out under enterprise contracts, and notes that product-usage-based tools lose value when customers don't regularly log in, because the platform lacks behavioral signals for health scoring, per the 2026 retention software comparison for agencies. Timeline is a data problem before it is a software problem.
Loyalty enrollment gets used as retention evidence far too often. A 2021 meta-analysis in the Journal of the Academy of Marketing Science examined 429 effect sizes from loyalty-program research published between 1990 and 2020 and found strong evidence that loyalty programs improve customer loyalty, while program design and industry conditions change the size of that effect, per the 2021 loyalty program meta-analysis. Connect program participation to repeat purchase, purchase frequency, churn or customer lifetime value, or you're counting inactive accounts as success.
Any item a vendor can't answer in writing is a gap to price in before you sign, not a detail to resolve after go-live.
When AI Retention Helps and When It Backfires
Automation is sold as loyalty-building by default. Sometimes it's the reason a customer walks. PwC's 2025 Customer Experience Survey found that 52% of consumers had stopped buying from a brand after a bad product or service experience, and 29% had stopped because of poor customer experience, while only 30% said AI had improved customer-service assistance and 38% said it had made it worse, per PwC's 2025 Customer Experience Survey.
Privacy shapes the same decision. A 2025 YouGov survey of roughly 10,000 people across 10 countries found that 67% would share personal data with AI assistants only if strong privacy protections were in place, with data security and privacy (57%), decision transparency (48%) and human oversight (46%) named as leading requirements, per Zendesk's release on the 2025 global survey.
The buying question is narrower than "does it have AI". It's when the automation reduces churn and when it accelerates it.
- Escalation to a named human the moment a customer shows a complaint or cancellation signal, not after three failed bot turns.
- A plain reason for the offer. If the platform can't explain why a customer received a discount, the customer will ask and nobody will have an answer.
- Human override on every automated save offer, with a logged decision, so a bad rule can be reversed without an engineering ticket.
- Churn measured separately for customers routed to AI and customers routed to a person, by segment and over a full renewal cycle.
Test AI-handled and human-handled groups before rolling automation across the base. The groups that get a person are the ones whose outcome you'll be explaining to finance.
Run a Controlled Test Before You Sign
Run the tool's logic on your own customers before committing. A demo shows the interface; a controlled test shows whether the intervention moves anyone.
- Write the outcome first. Name the stage where customers leave and the single number you need to move: renewal rate, repeat purchase, or 90-day retention.
- Split a comparable group. Treatment gets the retention action, control gets nothing. Comparable means similar tenure, spend and engagement at the start, not whoever signed up that week.
- Track the money, not the message. Incremental retention, repeat purchase or renewal rate, redemption cost, contribution margin and payback period, for each group.
- Run a full billing or renewal cycle. Late cancellations appear at the end of the cycle, and a two-week test will report a lift that evaporates in week six.
- Check the result by segment. A discount can pay for itself on high-value customers and destroy margin on customers who would have stayed anyway.
- Compare cost per retained customer across up to three shortlisted tools, using the three-year totals built earlier.
The guide to running a software trial covers the setup mechanics, including how to keep the control group clean while a vendor provides onboarding support.
Judge the result as incremental customer value rather than engagement. A Forrester Total Economic Impact analysis of Mastercard SessionM modeled $39.19 million in three-year benefits against $24.58 million in costs, producing a $14.61 million net present value and 59% ROI, per Forrester's Total Economic Impact study of Mastercard SessionM. That's a composite model, not a benchmark you can copy. Your result depends on baseline churn, margin, customer volume, and how much of the base the system can reach.
Buy the tool whose measured lift covers its total cost, and keep the control group running after launch. The first month after go-live is where most retention programs stop measuring.
Start with the sentence that names where your customers leave, then put a three-year total and a treated-versus-control result beside two shortlisted tools before you sign anything. KeenVerdict's software rankings and buying guides carry the prices, dates and sourced figures you need to build that comparison for customer retention software and the CRM, help desk and customer success tools it depends on, at KeenVerdict.
Questions or corrections: editorial@keenverdict.com